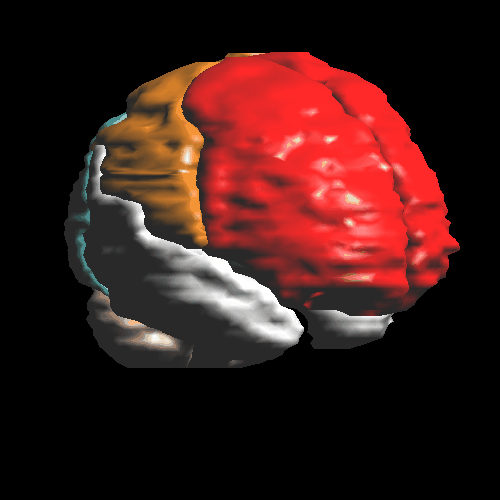
Surface renderring of the atlas anatomy
Matching of the 3D Atlas to a patient's brain
Matching of the atlas can be made interactively, fully automatic or in a semi-automatic way. For matching, a polynomial transformation with 27 parameters is used. It can account for individual variations in position, size and shape (see the atypical PET-brain below).
Interrogation of the atlas data base
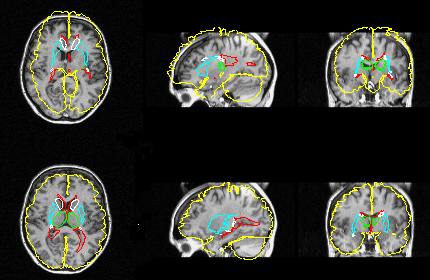
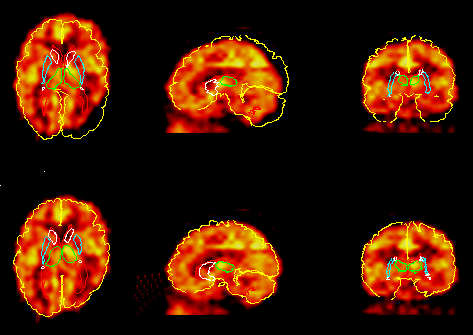
The atlas contains 3D descriptions of about 400 structures. Structures can be selected by their names and will then be drawn into displayed images, or the user can point and click in the images.
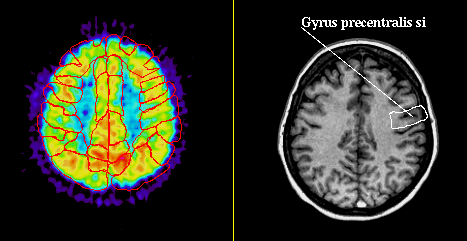
The image shows all Brodmann areas outlined in a PET-slice (left), and the identification of a single gyrus in an MR-slice using the point-and-click method (right).
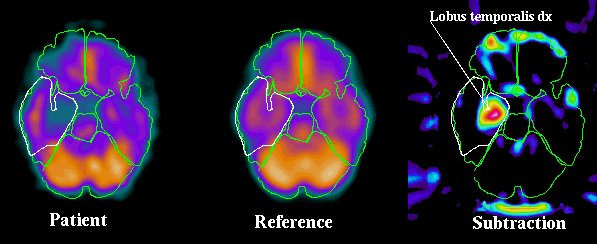
Automatic detection of hypoperfused areas in SPECT
The fully automatic intersubject registration technique in CBA allows for reference images representing "normality" to be created by averaging images from helthy volunteers. Images from a patient can then, after a preceeding normalization of anatomy and intensity, be subtracted from the reference volume. Deviations in the patient data from the normal state can be detected in this way and can be displayed in subtration images and t-test images.
