Introduction to computerized image analysis
Examples of images
At Centre for Image Analysis, we work with many different types of images. Some examples are:
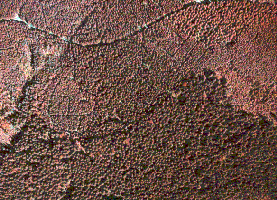
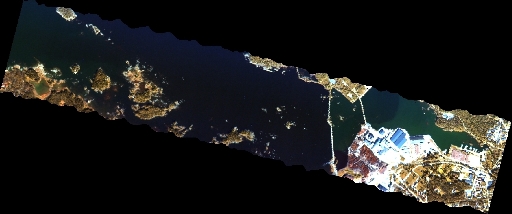
satellite images, i.e., images taken from a satellite. In this case, a pixel can be equal to 25x25 metres on the ground.
 |
| Agricultural area nearby Uppsala from a satellite |
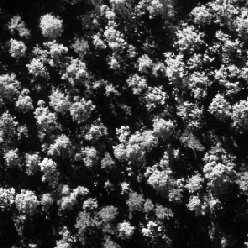
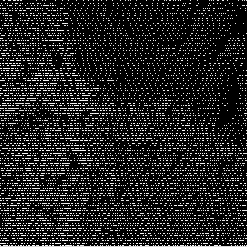
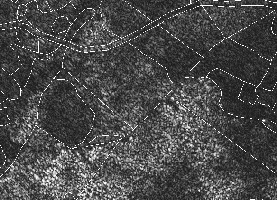
aerial images, i.e., images taken from an airborne sensor.
 |
 |
| Photographic image |
Laser data |
 |
 |
| Photographic image |
Radar data (for instance, roads are shown in white) |
 |
| Aerial image showing part of the east coast of Sweden, Norrsundet (pixels are 4x4 metres) |
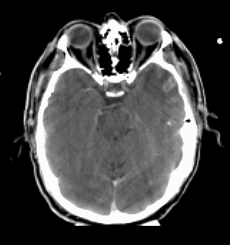
tomography (from greek - tomo, cut, och grafein, write), i.e., slicewise images of a three dimensional volume, for instance the human body. One way to obtain tomographic images is to use x-ray. This is called computerized tomography (CT). The images are directly stored in the computer. Each image corresponds to one slice of the body. The slices can be used to build up a three dimensional image. If we compare to a regular x-ray image, we see that all structures are put "on top of each other" - it is a projection. With CT we make many projections from different angles around the body. From the projections we can recontruct the three dimensional volume. The greylevel in CT image describes how easy it is for the x-ray to pass through the body.
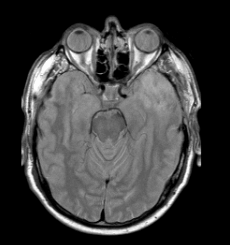
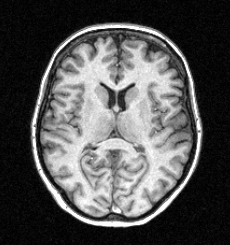
Other ways to contruct such images is to use magnetic resonance tomography (MR). In an MR image, the greylevel corresponds to the amount of water (or rather hydrogen) there is in the material in each position. With so called positron emission tomography (PET) we obtain an image showing the amount of activity in each position. A pixel in a CT or an MR image can correspond to 0.5x0.5 mm in the real world while in a PET image to 2x2 mm.
 |
 |
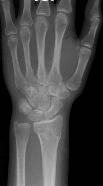
| X-ray image (skeleton) |
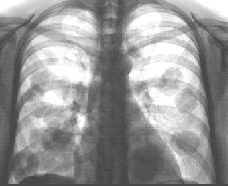
X-ray image (lung) |
 |
 |
| CT image (one slice) |
MR image (one slice) |
 |
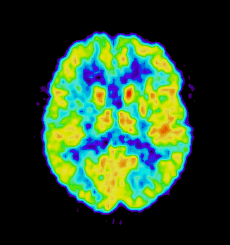 |
| MR image (one slice) |
PET image (one slice) |
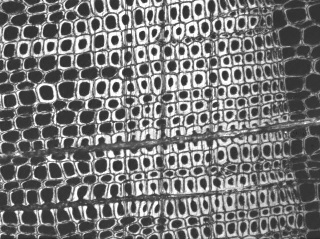
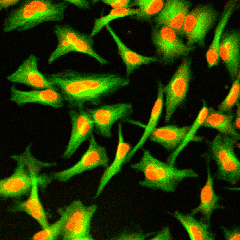
microscopy, i.e., images taken using different kinds of microscopes. Below to the left, we see a microscopy image of wood fibres. Here, each pixel can be 1x1 micrometres in the real world. To the left, we see cells in an image taken using fluorescense microscopy. The cell nuclei (red blob) is here around 10-20 micrometres in diameter. The DNA of the cells is stained with a red fluorescent substance and the cytoskeleton with a green fluorescent substance.
 |
 |
| Wood fibres |
Cells |
| (confocal microscopy) |
(fluorescense microscopy) |
synthetic images. Images that we create ourselves in the computer. This we often do for testing of our methods. With synthetic images it is easier to foresee what the result of a specific method should be. Below we see an example of a synthetic blood vessel. The aim here is to detect narrowings, stenoses, in the blood vessels.
 |
| Synthetic image of a blood vessel |
Under Examples you will find described more in detail how we work with the different types of images.